Climatology - Woodstock
Explore temperature and precipitation climatology for Woodstock, Virginia. Click the figures to download.
Climate and weather data for Woodstock are collected from a US Historical Climatology Network (USHCN) weather station.
Monthly Averages
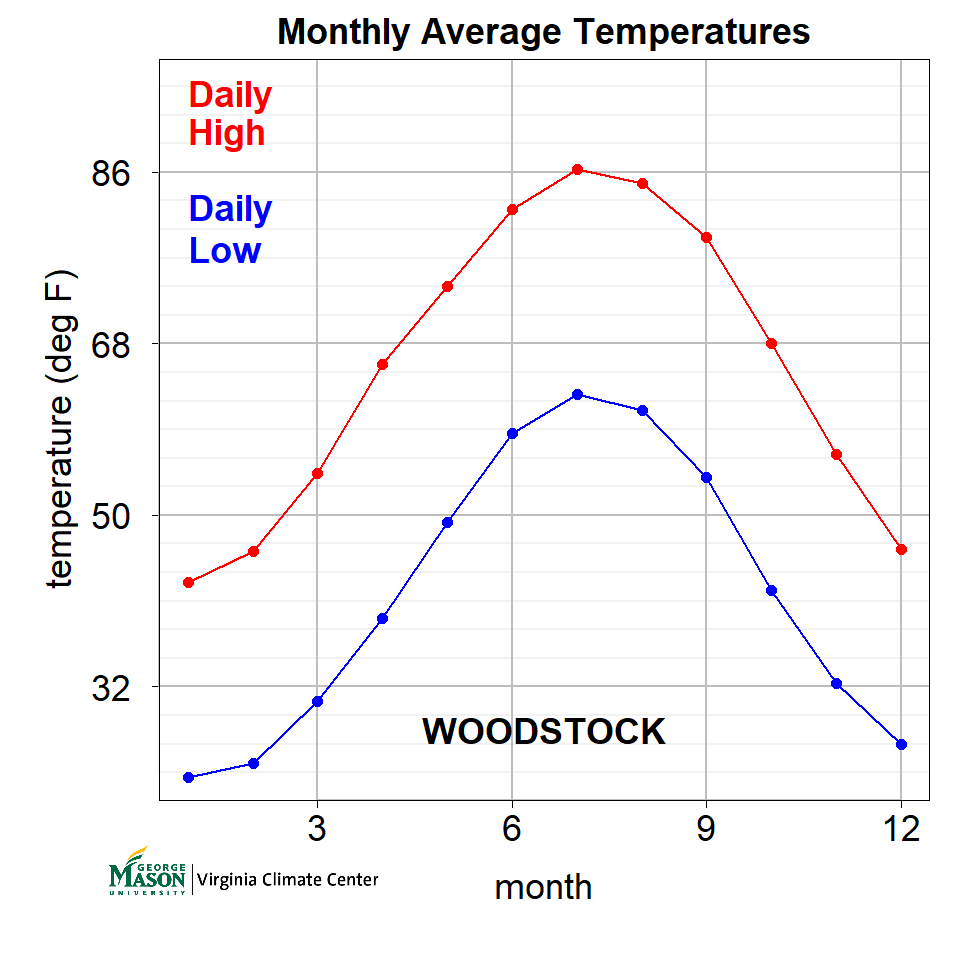
Temperature (“temp”) is dominated by the diurnal (daily) and annual cycles, which are captured by showing average daily high and daily low temps for each month.
Daily high = hottest temp of the day (usually early afternoon).
Daily low = coldest temp of the day (usually early morning).
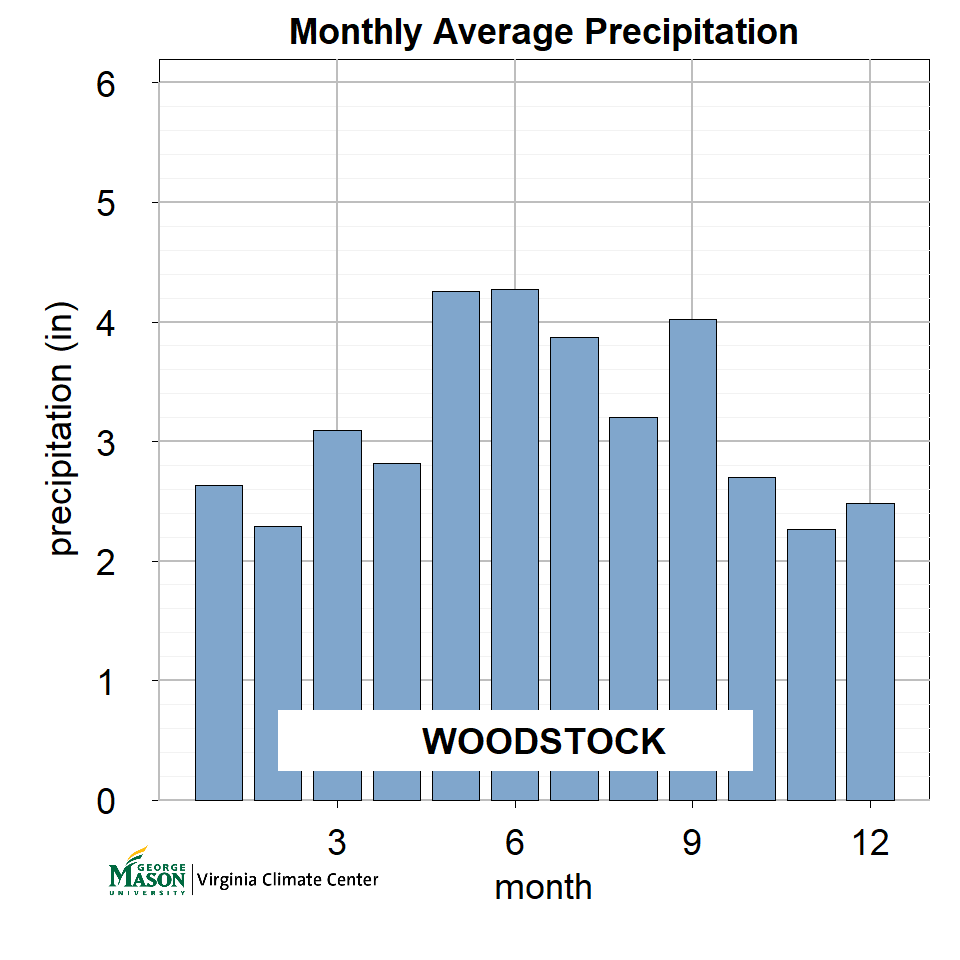
Precipitation (rain, snow, ice, and sleet) has a less prominent annual cycle, but tends to be higher in the summer than in the winter.
Monthly Distributions
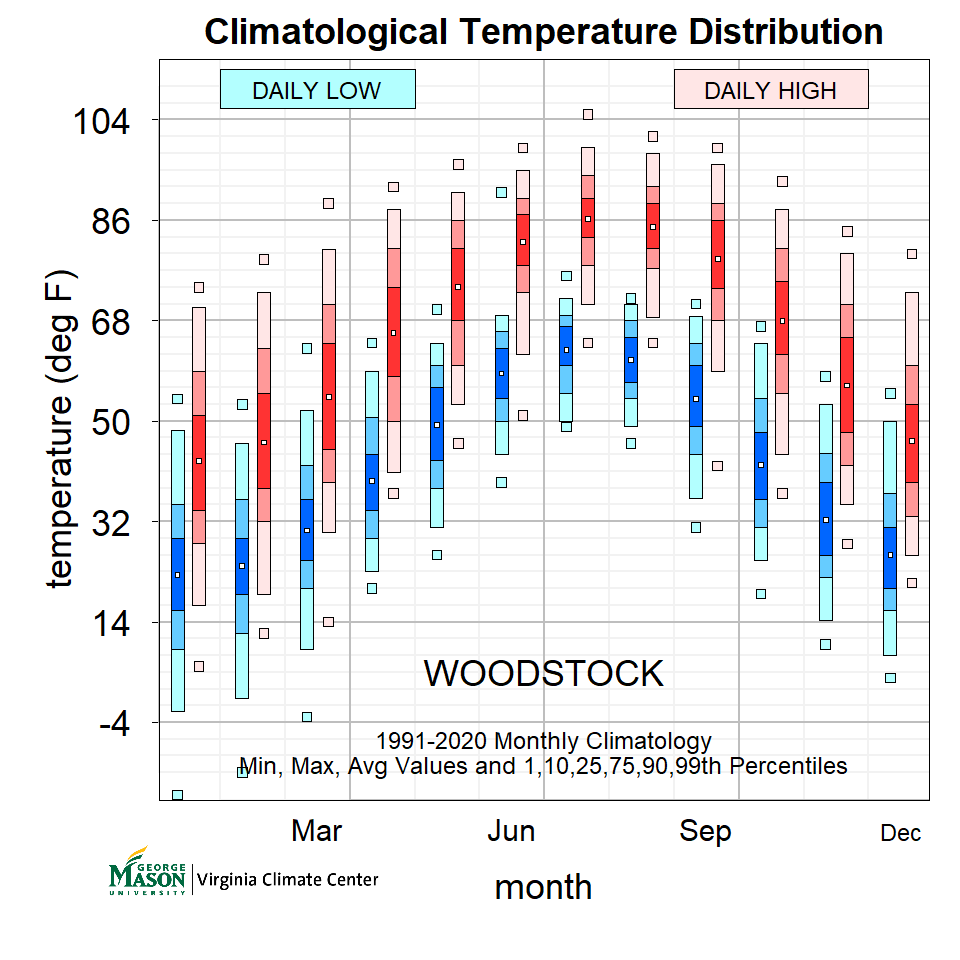
Like the monthly averages, temperature statistics are shown for both daily low and daily high temperature.
Each bar represents the range of daily temperatures. The darkest part of the bar shows the 25th to 75th percentile values: the temperature range that is above the coldest 25% of days and below the warmest 25% of days. The lighter parts extend the range from the 10th to 90th percentile, and the lightest parts extend it to the 1st to 99th percentile.
Small squares outside bars show the lowest and highest temperature during the entire 30 year period for a given month. Small squares inside bars show the monthly average.
The graph shows that daily temperatures are often over 10 degrees warmer or colder than the monthly average.
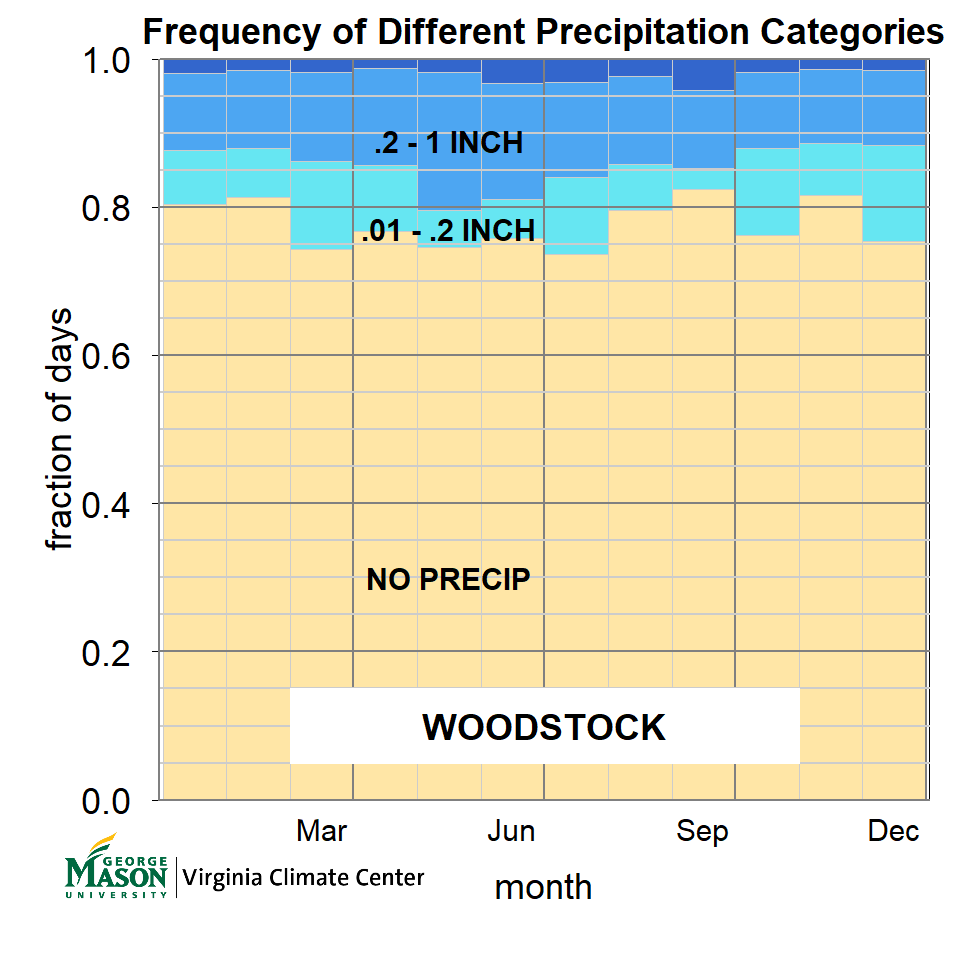
Precipitation (“precip”) has very different statistics than temperature. Every day has some temperature, but many days have no rain or snow. Therefore, we show the statistics differently.
Top figure shows what fraction of days have precip amounts in different ranges. Note that these values are daily precipitation. A typical monthly average value of 3 inches per month corresponds to about .1 inch per day.
While many days have precip that is roughly similar to the average, even more (typically around 40%) have none, and a substantial percentage (typically over 10%) have more than ten times the average.
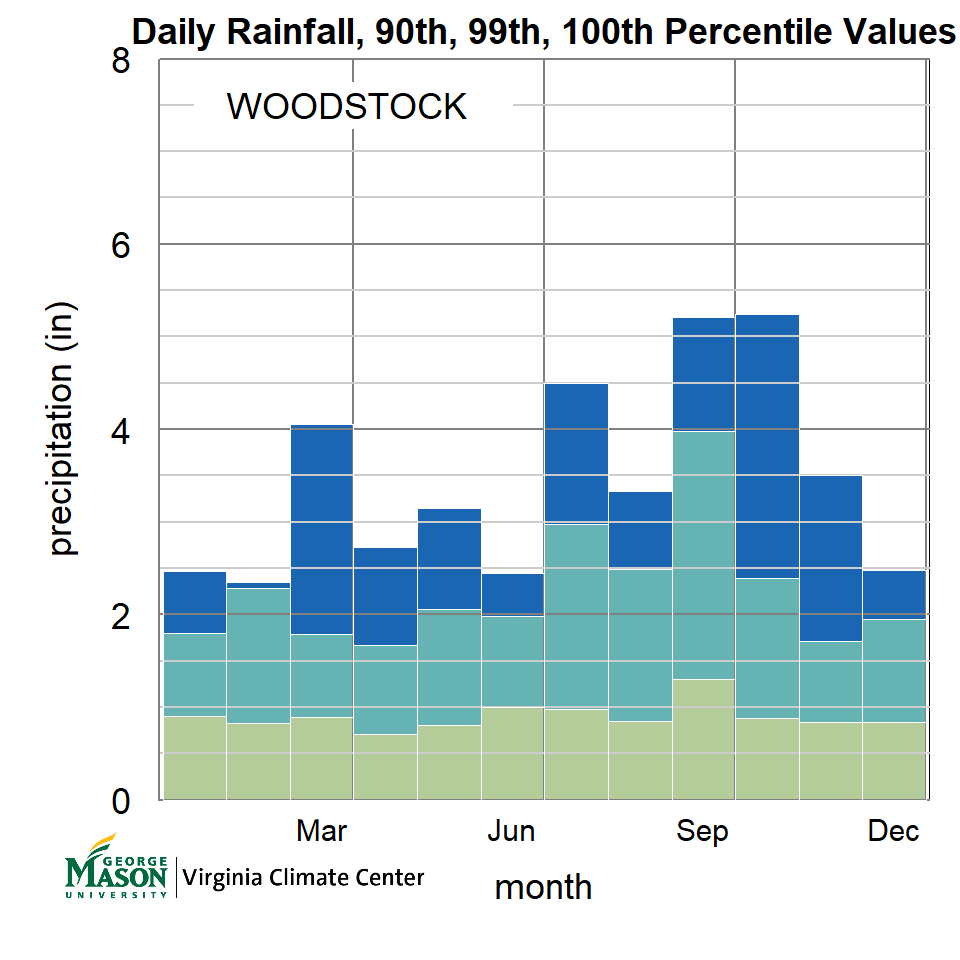
To get a better idea of the strength of extreme precipitation events, we plot the precip amount of the 90th, 99th and 100th percentiles.
Typical top 1% one-day precipitation is greater than 2 inches, and maximum precipitation can be over 4 inches in some months.
All percentiles for both temperature and precipitation are calculated from the whole 30 year record. For instance, June has 30 days, so during 1991-2020 there were 900 June days, and the 99th percentile precipitation was greater than all but the 9 rainiest days (1% of 900).
An individual day rarely has temperature or rainfall equal to the monthly average. Therefore, it is useful to know the distribution of values. There are many ways to measure distributions; some of which are shown here.