Climate Risks in Virginia
Many communities within the Commonwealth are facing threats of extreme heat, flooding, and increased risk of vector-borne disease. Learn more about these impacts and the consequences they may have on our communities.

Extreme Heat
Climate change is causing a rise in average annual temperature, often referred to as global warming, attributed to increasing levels of heat-trapping greenhouse gases in the atmosphere. Richmond, Virginia’s average annual temperature has risen 2.8°F since 1970, larger than the increase in US average temperature. Instance of days with a heat index of 90°F and above, or extreme heat days, has also been on the rise. In 2022, Richmond experienced eight more extreme heat days than in 1979.
Adaptation and mitigation to the impacts of extreme heat in Virginia is a research priority of VCC. Dangerously hot temperatures threaten human health; notably the elderly, underprivileged, and those with underlying health conditions. Electricity grids could be overwhelmed during heatwaves due to larger demand for cooling systems causing widespread black outs. Our experts will co-produce research with our partners in order to provide the best information to local decision makers and prevent the worst consequences of extreme heat on Virginia’s communities.
Click on the images below to explore temperature and extreme heat data for other cities in Virginia.


Flooding
Changes in precipitation due to climate change are variant in space and time. However, a general rule of thumb to describe these changes is, “wet gets wetter, dry gets drier”. In Virginia, annual rainfall has increased four to six inches since 1950. Much of the precipitation occurring is more intense, preventing soil absorption and exacerbating runoff. Norfolk’s annual average hourly rainfall has increased since 1970.
Increasing and more intense rainfall compounds to pose threats to Virginia’s infrastructure and communities. Without the proper measures, excess runoff has the ability to overwhelm systems such as wastewater leading to a cascade of other risks. Damage to property, loss of life, and public health threats are significant concerns and VCC is dedicated to producing quality research and knowledge to address these concerns and protect the Commonwealth’s people and property.
Click on the images below to explore precipitation and hourly rainfall data for other cities in Virginia.


Vector-borne disease
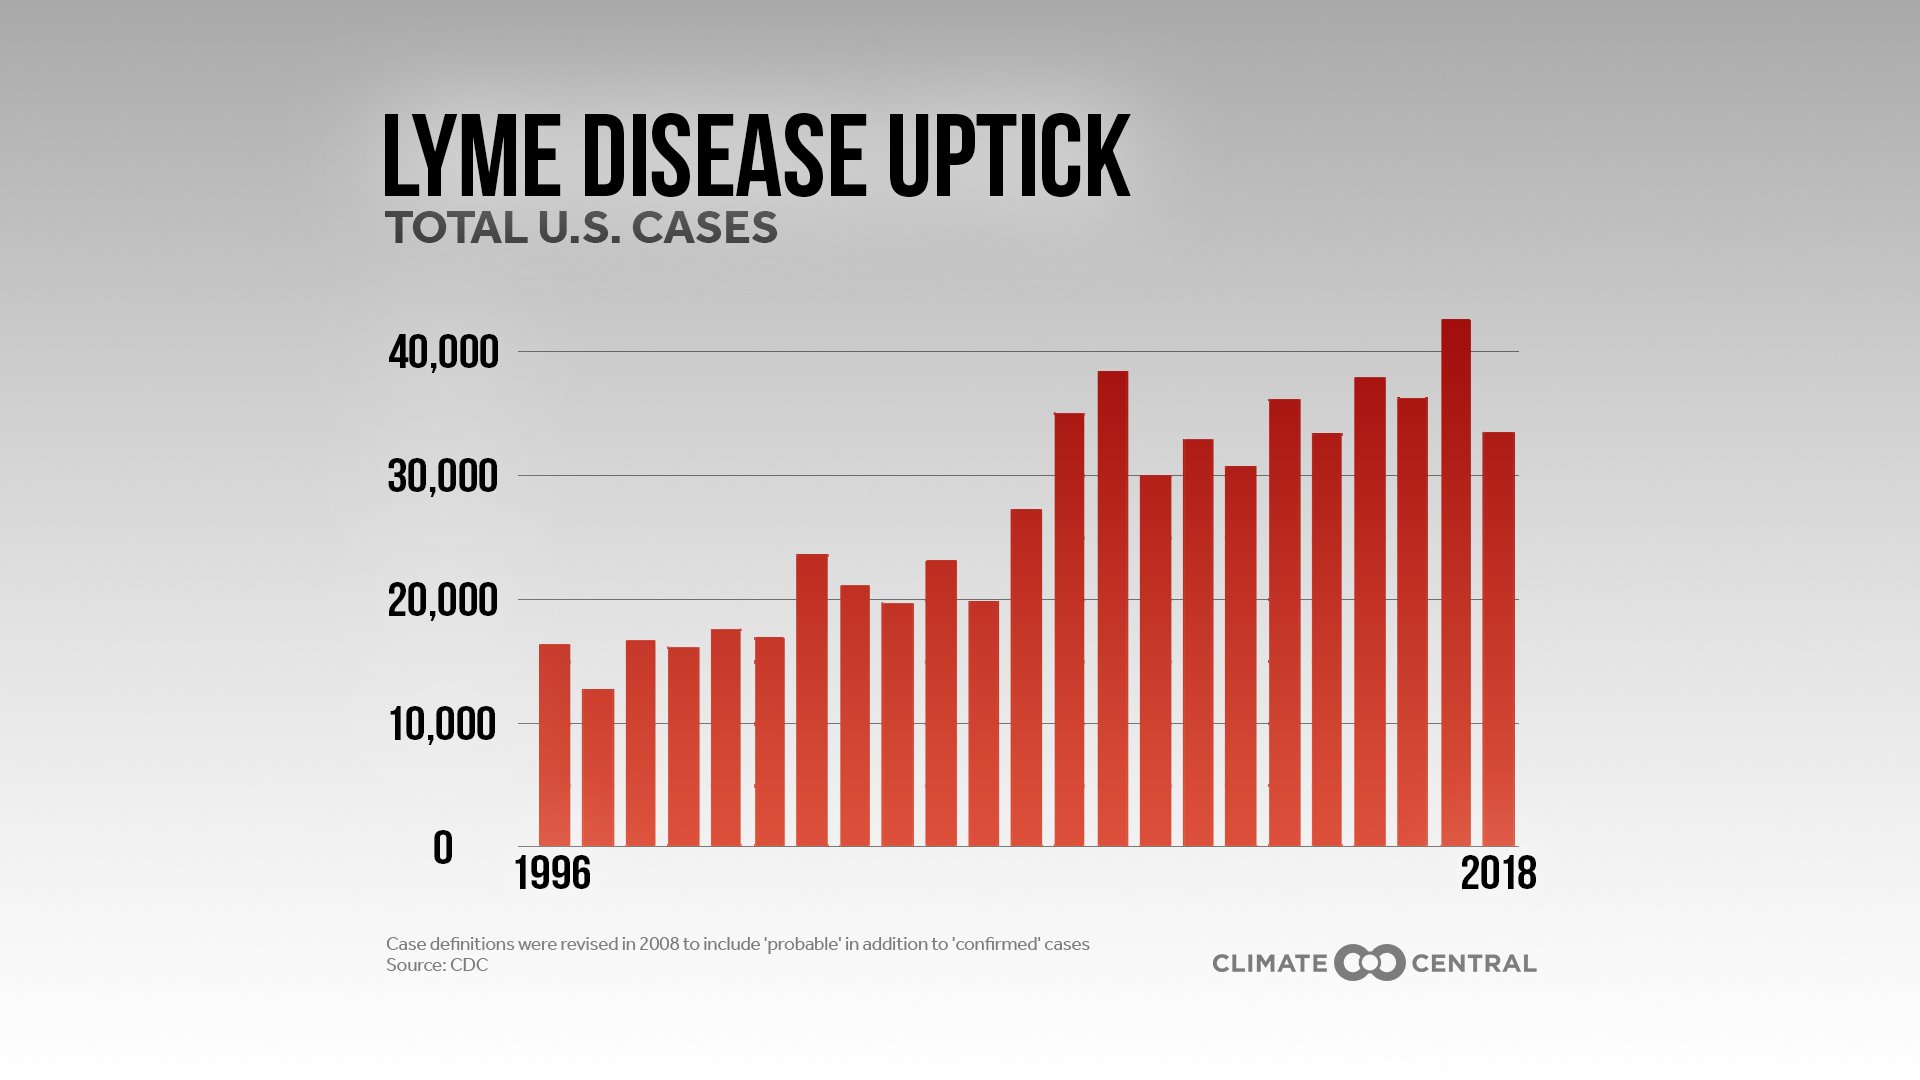
Rising temperatures and longer warm seasons allow pests, namely mosquitoes and ticks, to survive longer and thrive in locations that may have once been unfavorable. These pests often act as vectors through which diseases such as Lyme disease and West Nile virus can spread to humans and animals. Mosquito days are categorized as days in which weather is optimal for the insects with temperatures between 50-95°F in addition to a relative humidity of 45% or greater. Charlottesville experienced 171 mosquito days per year during the 2010s compared to 159 mosquito days per year in the 1980s. Risk for Lyme disease has also increased as cases in the United States continue to climb.
The VCC views climate change as one of the greatest threats to public health here in Virginia and around the world. Our team of experts will collaborate with local decision makers in the Commonwealth to minimize the risk of vector-borne disease in our communities and seek solutions to subsequent public health concerns.
Click on the images below to explore vector and disease data for other cities in Virginia.